
1. Define your Time Frame
The time frame you choose to trade should fit your personality. If you don’t have time to watch the markets all day long and need more time to analyze each trade then you are a natural long term trader.
The time frame of your charts should be either daily or even weekly. In this way you will make fewer transactions and pay the spread less often. Since your system will issue only a few signals each month or year, you will have to be patient. Long term trades require bigger stops, so a bigger account is needed if you don’t want to receive margin calls.
On the other hand, if you are impatient, you spend most of your time watching the screen and you feel the urge to press the button, a long term time frame is not for you. Instead you should be an intraday trader using 15-minute or even 1-minute charts.
In this way you will have many trading opportunities every day and you will avoid overnight risks. However, you will pay the spread more often and you will need more stamina to remain focused and frequently change biases.
Somewhere in the middle are the swing traders, who use hourly charts to execute short term trades that last for several hours or even days.
2. Identifying Market Position
It is important to identify the trend and the wave in the time frame you want to trade in. You should always trade in the direction of the trend.
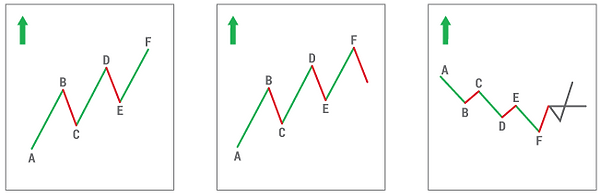
In the illustration above you see an uptrend which we defined as a series of consecutive higher highs and lows. This uptrend consists of 5 waves:
Wave 1: from A to B
Wave 2: from B to C
Wave 3: from C to D
Wave 4: from D to
Wave 5: from E to F
You also notice that waves 1, 3 and 5 move in the direction of the uptrend, whereas waves 2 and 4 move opposite the direction of the uptrend i.e. they are corrective.
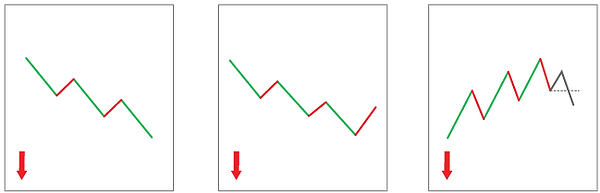
Similarly, in the figure below waves 1, 3, and 5 move in the direction of the downtrend, whereas waves 2 and 4 move opposite the direction of the downtrend.
Trend
We use 4 indicators to identify the trend and use arrows to visualize the direction.
Uptrend
Downtrend
Range
MACD against zero line. If MACD > 0, then Uptrend If MACD < 0 then Downtrend
Exponential moving average of 55 periods (EMA55) against price. If EMA (55) is higher, then the price is going Up
If EMA (55) is lower than price, then is goind Down.
Price ROC of 25 periods against zero line. If ROC (25) > 0, then Uptrend. If ROC < 0 then Downtrend
If there are more UP arrows than DOWN arrows, the trend is up – and vice versa.
Note that if the market is trading in a range, the only indicator that can be used is ROC(25).
Wave
We use the following 4 indicators to identify the direction of the wave:
RSI (14) against its simple moving average of 7 periods (RSI7). If RSI (14) > SMA (7) then it is going Up, if RSI (14) < SMA (7) then it is going Down.
MACD against its signal line. If MACD > Signal then it is going Up. If MACD < Signal then it is going Down.
Exponential moving average of 20 against price. If Price > EMA(20) then it is going Up.If Price < EMA(20) then it is going Down.
Stochastics (14,3,3). If %K line > %D line then it is going Up, If %K line < %D line then it is going Down.
If there are more UP than DOWN arrows, the wave is up and vice versa.
Overbought / Oversold
Once you identify the trend and Wave what is left is to check if the market is overbought or oversold.
In the illustration above both the trend and the wave are UP. However, at point F the market might be overbought. As a result, a correction should be expected. So, it is better to wait before you buy.
At point G the trend is UP but the wave is down. If the market is oversold, a good buy opportunity arises.
We use 2 indicators to identify overbought/oversold conditions.
-
Histogram MACD at extreme levels
-
ROC (7) at extreme levels
Now you have learnt how to analyze the market and identify the direction of the trend and the wave. You also know that you always trade in the direction of the trend, in the time frame you choose to trade.
So when the trend is up you BUY and when the trend is down you SELL. The question is when you BUY or SELL? It is always safer to enter your trades near support or resistance levels as you can control your risk better.
3. Find Support and Resistance levels.
There are various methods that you can use to find support and resistance levels.
-
Peaks and troughs
-
Support and resistance levels from a previous time frame
-
Fibonacci levels
-
Moving averages
-
Trend lines
Peaks and Troughs
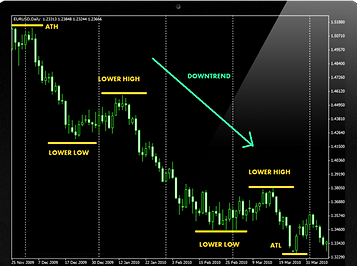
Once you open the chart in the time frame you will be trading, identify the highest peak on the chart and mark it as the All Time High (ATH). Then find the lowest bottom and mark it as the All Time Low (ATL). In the example below, we have a chart showing prices are in a downtrend. You mark each peak and trough with a short horizontal line. In a downtrend, each lower low will be a support level and each lower high will be a resistance level. Just have a look at the the chart below.
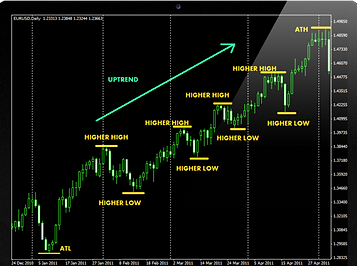
In an uptrend, we have the opposite. Each consecutive higher peak will be a resistance level, and each higher trough will be a support level.
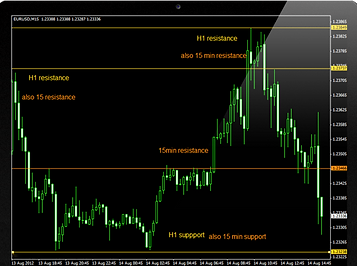
Support and Resistance from Previous Time Frames
Another way to find support and resistance levels is to look in higher time frames to find the levels from there. Looking at the chart below for example, if you are currently using a 15 minute time frame, look in the 1 hour time frame and incorporate the support and resistance levels from there into the 15 minute time frame. Then look into the 4 hour time frame and take those support and resistance levels to put in the current 15 minute time frame. Note that if the support and resistance levels from higher time frames match those support and resistance levels of the lower time frame, (meaning they have the same price levels) then these would be more important and stronger support and resistance levels.
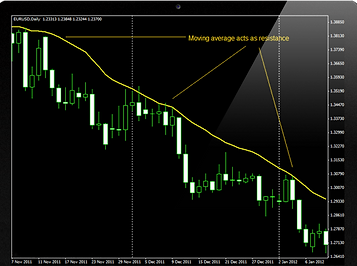
Moving Averages
Another method of finding support and resistance levels is using moving averages.
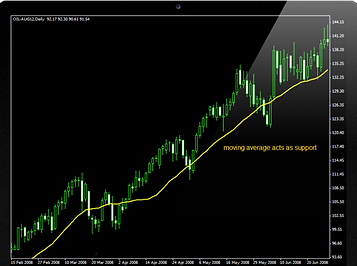
In a downtrend, the moving average line usually acts as a resistance and prices bounce off it and fall back down, as we can see in the chart above. In an uptrend, the moving average acts as support. In the example below, we can see that prices bounce off the moving average. We normally call this type of support, dynamic support, because the level changes every time the moving average moves.
You can use different periods of moving averages, such as the 20-day moving average or the 55-day, and so on. It can be a simple or exponential moving average. We looked at moving averages in detail in an earlier section of the course.
Fibonacci Levels
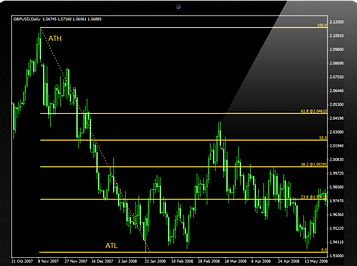
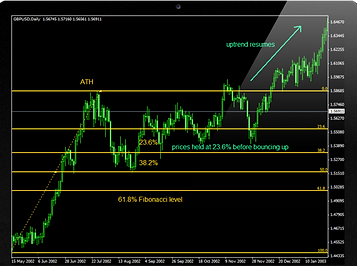
Another popular method of finding support and resistance levels is to use Fibonacci retracement levels. We will not go into detail right now about Fibonacci since we have already explained this subject earlier in the course. What we would like to point out now is that the Fibonacci Retracement levels are used for support and resistance. The most common levels used in forex are 23.6 %, 38.2% and 61.8%.
After a significant price move, either up or down, prices will often retrace a significant portion of the original move. As prices retrace, support and resistance levels often occur at or near the Fibonacci retracement levels.
Let us look at an example. In an uptrend, we mark the Fibonacci retracement levels from the ATL to the ATH. In the chart below, we can see that after a strong move up, prices retraced part of that upmove by 38.2% and 23.6%, where prices rested for a while. Therefore, we can use this 23.6% and 38.2% Fibonacci retracement level as support levels. Also once ATH is penetrated, this can be used as a new support level.
In a downtrend, we mark the 23.6%, 38.2% and 61.8% Fibonacci retracement levels from the ATH to the ATL. We can see in the chart that after a strong move down, prices retraced to reach various Fibonacci retracement levels. We can use these retracements as resistance levels.
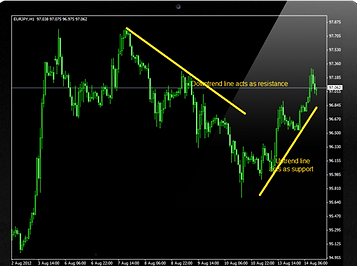
Significance of Trend Lines as Support and Resistance
In the chart below we can see that the uptrend line acts as support and price action appears to hold above this line. In a downtrend, prices stay below the downtrend line, which acts as resistance.
It is required to have at least two points, either two peaks or two bottoms in order to draw a trend line. This would be called a tentative trend line. If we have three or more points, this will be a valid trend line. The more points a trend line has, the more confirmed and the more important the trend line becomes.
When prices trade sideways in a range, they create strong support and resistance levels. This is because prices test these levels several times and bounce between the same support and resistance level a few times.
Once we find the support and resistance levels using all methods, we combine all the levels to select the more important ones. The most important are those levels who coincide when using different methods. For example if a trough coincides with 61.8% Fibonacci retracement and also with EMA (55) then it should be regarded as potentially strong support.
Now you know how to find the direction of the Trend and Wave at the time frame you choose to trade. You also learned how to find potential support and resistance levels close to which you should execute your trades. Now you will learn when to BUY or SELL.
4. Find you Entry Levels.
First of all, you should now that there are three main ways to enter the market:
-
Trading the Bounce
-
Trading the Breakout
-
Trading the Trend Reversal (Failure Swing)
Trading the Bounce
This is a highly preferred strategy as it is usually less risky than any other methods. In an uptrend this strategy involves buying on dips (the pullback), while in a downtrend you would sell on rallies (after prices temporarily bounce back up before continuing to fall). You identify support and resistance levels on our chart by applying the methods explained in the previous section. After marking these levels, you can focus on looking for a good entry point.
Example for Buying the Dip
In an uptrend, you wait for prices to dip to a strong support level and wait for a bounce from this support for prices to rise again. At his point the trend is UP and the wave is DOWN. If ROC (7) and Hist MACD are both oversold, there is a higher probability that the support will hold.
It is usually best to wait for prices to bounce first before we BUY rather than set an order right on the support. This way you can make sure the support level will hold.
Be careful not to buy on a black candle. You also make sure the white candle has a long body. Wait for this white candle to close above the close of the last black candle before you enter a buy position. You place a stop loss a few pips below the support level, in order to minimize our losses in case the market does not move the way we want it to.
To sum up, the following conditions should apply when you buy a dip:
-
Trend is up
-
Wave is down
-
ROC (7) and Hist MACD are oversold
-
Prices bounce from a strong support
-
Buy on a white candle
-
Set your stop loss below support
Example for Selling the Rally
Similarly the following conditions should apply when you sell a rally:
-
Trend is down
-
Wave is up
-
ROC (7) and Hist MACD are overbought
-
Prices bounce off from a strong resistance
-
Sell on a black candle
-
Set your stop loss above resistance
Trading the Breakout
This trading strategy is more risky than the bounce strategy. In an uptrend this strategy involves buying when prices break a resistance level. In a downtrend, you sell after prices cross below a support level. Usually, a breakout takes place out of a certain chart pattern, such as a consolidation range, a triangle, or a flag, etc.
Filter: To assume that the breakout is valid you should turn to a 1-minute chart and wait for two white candles above resistance or two black candles below support.
Example for Buying the Break of a Resistance
The following conditions should apply when you buy a breakout:
-
Trend is up
-
Wave is up
-
ROC (7) and Hist MACD are not overbought
-
Buy when prices break a Resistance level. Remember your filter.
-
Set your stop loss below EMA(55) in a 1-minute chart.
Example for Selling the Break of a Support
The following conditions should apply when you sell a breakout:
-
Trend is down
-
Wave is down
-
ROC (7) and Hist MACD are not oversold
-
Sell when prices break a support level with a strong black candle
-
Set your Stop Loss above EMA(55) in a 1-minute chart
Trading the Trend Reversal (Failure Swing)
A failure swing signifies that a trend is about to reverse. This is a good opportunity to enter the market.
Example for Buying the Trend Reversal (Failure Swing)
In a downtrend, prices fall to the lowest point F but subsequently the trend weakens and prices are unable to form a new low. In this case we have a failure swing. Price fail to swing lower and trough H is higher than the previous low. So prices continue to rise breaking resistance level G, and you would enter a buy position at point I.
The following conditions should apply when you buy a trend reversal:
-
Trend turns up
-
Wave is up
-
ROC (7) and Hist MACD are not overbought
-
Buy when prices break previous high with a strong White candle
-
Set your Stop Loss below EMA(55) in a 1-minute chart
Example for Selling the Trend Reversal (Failure Swing)
In an uptrend, prices rally to peak F, but subsequently the trend weakens and prices are unable to form a new high. In this case we have a failure swing. Price fail to swing higher and peak H is lower than the previous peak. So prices continue to drop past support level G, and you would enter a sell position at point I.
The following criteria should apply when you sell a trend reversal:
-
Trend turns down
-
Wave is down
-
ROC (7) and Hist MACD are not oversold
-
Sell when prices break previous low with a strong black candle
-
Set your Stop Loss above EMA(55) in a 1-minute chart


5. Find your Exit Levels
Beginners look for promising entry points and they believe that when they find them that will give them money. Professionals on the other hand, spend a lot of their time managing their trades and looking for exits. If you truly want to trade with more profits than losses, you should consider the information below.
There are 2 kinds of exit signals: Stop Loss and Take Profit.
Setting the Stop Loss
Your stop loss depends on your entry point, and so for each entry point we analyzed in the previous section you already know where to set your stop loss.
Trading the Bounce
Example for Buying the Dip: The stop loss should be below support G.
Example for Selling the Rally: The stop loss should be below resistance G.
Trading the Breakout
Example for Buying the Break of a Resistance: The stop loss should be below EMA (55).
Example for Selling the Break of a Support: The Stop Loss should be above EMA (55) 1-minute chart.
Trading the Trend Reversal (Failure Swing)
Example for Buying the Trend Reversal (Failure Swing): The stop loss should be below the failure level H.
Example for Selling the Trend Reversal (Failure Swing): The stop loss should be above the failure level H.
Set Your Take Profit
Close 50% of the position at 161.8% Fibonacci extension level and change the stop loss of the remaining at the opening price. At the next resistance close 50% of the remaining position (25% of the original position) and move the stop loss higher. At the next resistance close the remaining 25%.
6. Use Multiple Frame Analysis
A currency pair exists on several time frames – the daily, the hourly, the 15-minute, even the 1-minute! When trading we use what we call multiple time frame analysis. This means you do not use only one time frame to place your trade. You will need to look at the next time frame higher so that you can gain perspective on the general trend and then use the lower time frame to make your entry.
This is because the direction of the trend could be different in each time frame. For example EURUSD could be an uptrend in the daily chart and a downtrend in the 4-hour chart. Using multiple time frame analysis will help you minimize losing trades because you will be able to identify where you are in relation to the bigger picture. There could be a new trend emerging from another time frame than the one you are trading in, and if you don’t check it, it could hurt you.
See point B in the figure above, the market is in a downtrend in the 60-minutes after it completed a failure swing. However if you look at the 4-hour chart, you can see that only the wave is down but the trend is still up. So if you just looked at the 60-minute chart you would have sold at the point where the market would recommence its uptrend.
How to Analyze The Market
The proper way to analyze any market is to analyze it in at least two time frames. Note that the pair of time frames you use will be related by a ratio of about 1:4. What does this mean?
For example, you would not use a 1 minute time frame to trade and use it with a monthly chart to look at the trend! This is an extreme example but it demonstrates that you should use one time frame above for the trend versus the time frame you are trading in. If you are a long term trader, use the weekly chart to determine the trend, then go down to the Daily chart to trade. A short term trader will use the Daily for the trend and the 4 hour to trade. In our case we use 4-hour charts to analyze the big picture and 60-minute charts to enter our trades. The trades in the direction of the 4-hour trend are more likely to be winners.


