1. The Flow of Money
Major Currencies Rule Forex
Regarding fundamental analysis, the big picture starts with the major currencies that make the world go round. You already know that in forex there are 8 most commonly traded world currencies. Why not more? Because these are the currencies of the most economically and politically stable economies in the world, like the USA, Japan, and Switzerland. Thanks to their overall liquidity, the most actively traded currency pairs are the following:
-
EUR/USD
-
USD/JPY
-
GBP/USD
-
EUR/JPY
-
AUD/USD
-
GBP/JPY
-
EUR/CHF
-
USD/CHF
-
USD/CAD
-
EUR/GBP
-
AUD/CAD
-
NZD/USD
-
GBP/CHF
-
CHF/JPY
-
EUR/CAD
-
AUD/JPY
-
EUR/AUD
-
AUD/NZD
Price Movements
Economic and political events taking place in the countries, whose currency is in demand, influence the upward or downward price movements of that particular currency. This is why you shouldn’t only concentrate on a single currency, but follow world events and keep an eye on the global flow of money.
Imagine a Chinese-European scenario. China wants to import products from Germany and Belgium. As China can’t use their local currency (yuan) in the eurozone, they must first buy the euro to be able to pay for these products. This will, of course, create greater demand for the euro.
At the same time, there may be a Chinese tycoon, who builds up a factory in Germany, and even starts investing long-term in the German stock market. To do so he must purchase euro. This also adds to the large euro inflow into the German economy, and increases the demand for the euro even more. Since every price in the free economy depends on supply and demand, the euro will rise against yuan.
The more the German, Belgian, and Dutch economies grow, eventually the bigger inflation gets. This means that their products get more expensive. As a result, the European Central Bank will raise interest rates to keep inflation under control. Because of the growing interest rates, more and more investors will start investing in European bonds at increased profits. This will further strengthen the euro against the yuan.
So what does China do after all these changes have happened? Well, they will try to find another country to import from at lower prices. As a result, the flow of money to the eurozone decreases and eventually the euro will fall.
Volatility and Dynamics
According to this scenario, it seems that there is no stability whatsoever. That is true and that is why the forex market is so dynamic and volatile. As you see, power relations change. If you want to keep a pulse on how money flows and which currencies are getting stronger or weaker, you will use economic indicators to help you decide when and which currency pair to buy or sell.
Are there safe-haven currencies at all? Yes. For instance, the US dollar, the Swiss franc, and the Japanese yen. When there is global economic uncertainty big investors turn to safe destinations. Since the US, Swiss, and Japanese economies are considered the safest, their currencies are going strong.
2. Economic Indicators
Economic indicators consist of financial and economic data that allow analysis of economic performance and predict future performance. Regularly published by governmental agencies and the private sector, economic indicators help market observers follow financial market movements through indices, earning reports and economic summaries.
How to Benefit from Economic Indicators?
Economic indicators help you consider trades in the context of economic events and understand price actions during these events. You do not need advanced knowledge of economics to make use of an economic calendar, as not every single data release must be analyzed in-depth. By following GDP indicators, for instance, or inflation and employment strength, you can anticipate market volatility and identify potential trading opportunities. You should also know which economic indicators have a greater impact in terms of trading. For example, leading indicators change before the economy starts following a trend – they predict economic changes. Lagging indicators, on the other hand, change after the economy has already started following a trend – they confirm economic changes.
Most Important Economic Indicators
Let’s see the economic indicators that are most useful to you:
-
GDP (Gross Domestic Product)
It indicates the economic growth of a country, and it’s determined by product output, income and expenditure. GDP is often correlated with the living standard. It is the market value of all services and goods produced in a country during a certain time period.
-
Non-farm payroll employment
Monthly report released by the US Department of Labor. It provides statistical data about the current state of the US labor market. It is also used to forecast future levels of economic activity.
-
Unemployment rate
The percentage of unemployed people. It is measured by the ratio of people who are out of work and who are willing and able to work as opposed to the total number of people in the work force. It is an indicator that changes along with economy (=lagging indicator). It gives you hints about future interest rates and monetary policies.
-
CPI (Consumer Price Index)
Statistical estimate that measures changes in the price of services and consumer goods. CPI is used as a measure of inflation, as it reports price changes in over 200 categories.
-
CCI (Consumer Confidence Index)
Measures consumer confidence (e.g. a drastic decrease in consumer confidence may be a sign of a weakening economy).
-
PMI (Purchasing Managers Index)
Indicates economic activity. It shows the percentage of company/business employees in charge of goods and service acquisition (called purchasing managers) in a particular economic sector. PMI over 50 usually indicates an expanding economy, while anything below 50 indicates economic contraction.
-
Retail Sales
Monthly report that measures consumer expenditure (an essential indicator of GDP in the US). As a timely indicator of broad consumer spending patterns, it can be used to assess the immediate direction of an economy.
-
Average Hourly Earnings
A leading indicator of consumer expenditure. It evaluates the inflation level incurred by all economic sectors (excluding the farming industry) when wages are being paid to employees.
-
IPCU (Industrial Production and Capacity Utilization)
Measures economic activity. It’s released by the US Federal Reserve in the form of a monthly report, and it shows data for the previous month about the total amount of US industrial production. The IPCU encourages buying or selling in certain industries.
-
Durable Goods Orders
Key indicator of future manufacturing activity.
-
ECI (Employment Cost Index)
A quarterly economic series that indicates the rising and falling tendencies in employment costs. It measures inflation in salaries, wages and employer-paid benefits in the US.
-
Gross Domestic Product Deflator
A measure of price levels for all goods and services in an economy. The use of the deflator helps to calculate the difference between the nominal and real GDP.
-
IP (Industrial Production)
Indicates the changes in output for the industrial sector (e.g. manufacturing, mining). It indicates the industrial capacity of a country.
-
IFO (Institute for Economic Research)
A business survey based on the feedback of over 7,000 German business leaders. Based on latest economic data, it provides assessment of the current and upcoming economic climate in Germany and Europe.
-
International Trade (Trade Balance)
Measures the difference – imports vs. exports – of all goods and services. Market trends are indicated by changes in imports and exports, together with the level of the international trade balance.
-
NAPM Index (National Association of Purchasing Manager)
Measures economy in general, and the manufacturing sector in particular. It sums up the survey of over 250 companies in all US states, and it calculates data on production, new orders, and employment.
-
PPI (Producer Price Index)
A frequently used economic indicator that measures the average changes in selling prices received by domestic producers in manufacturing, mining, electric utility, and agriculture.
-
Tankan (Short-period Economic Observation)
A quarterly business poll issued by the Bank of Japan on the status of the Japanese economy. It affects the currency rate and stocks significantly, so it’s considered a major financial indicator in Japan.
3. News Trading
News Matters
The proverb No news is good news never applies to the forex market. News makes the market move. And very fast!
So far you have learnt about the main economic indicators. How do you know what’s going on around the globe? By following current social, political, and economic changes in the countries whose currencies you usually trade (e.g. GDP reports, consumer price index, unemployment figures, interest rates). All these indicate future price movements, and they will be beneficial in the long term.
Additionally, you can be alert to unexpected changes and read important economic news announcements. To gain an advantage over others, many forex traders and investors follow these announcements, and use a technique called news trading. News trading may be beneficial in the short term.
How News Trading Works
News trading means that you trade a foreign currency right before or after an important economic news announcement has been published. Why? Because after such announcements you can expect market prices to fluctuate, that is, move either up or down. And your aim is, of course, to benefit from these price movements directly.
Any currency pair may move very fast either up or down within just a few minutes before or after an economic news release. Let’s say the Federal Bank of the United States has just announced an increase of the interest rate. This means that many traders will invest in the US dollar because its value is likely to increase. This can have quite an impact on the outcome of your trades, can’t it?
News has the ability to increase market volatility (price variations) very quickly. But where can I get such news from?, you ask. From online news feeds. Here are the top 7 news sources that can send you updates:
-
Bloomberg
-
Forbes.com Breaking News
-
Reuters Business and Finance
-
BusinessWeek
-
Financial Times
-
CNNMoney
-
CNBC
On any given day, you can read economic news announcements on all major currencies (USD, GBP, EUR, JPY, AUD, CHF, CAD, NZD) and currency pairs.
The Risks
Remember, however, that news trading alone has its risks. The potential profits are huge – but so are the potential losses.
When you news trade, you must take decisions as fast as lightning, otherwise you may end up on the losing side. Stop-loss orders are also quite risky in news trading: due to the sudden and unexpected price fluctuations, the probability of slippage is very high. Slippage occurs during high market volatility caused by news events, and it means that your orders may be executed at a worse price than you expect.
What should I do then?, you ask. Good question! As a beginner trader, don’t rely on news trading alone. You will need much more practice to become a professional news trader.
Why did you tell me about it then?, you want to know. Because it’s a common technique – but as a beginner, you are not fast enough to cash a fortune by simply reacting to news. There’s much more to trading, and pretty soon you will learn about some other techniques that help you earn a steady profit.
4. Carry Trades
A carry trade strategy is when a trader sells (i.e. borrows) one currency that is from a country with a relatively low interest rate and then with those funds, a different currency yielding a higher interest rate is purchased. The aim of this strategy is to make profit from the interest rate differential. Sometimes the difference between the rates can be substantial and also adding leverage can really multiply profits.
A common carry trade is for the currency pairs of AUDJPY, NZDJPY, or USDJPY. The main reason is because Japan has kept low interest rates for quite a long time now. Australia and New Zealand have one of the highest interest rates in the developed world! In 2011 interest rates in Australia were as high as 4.5 percent!
How Carry Trading Works in Forex
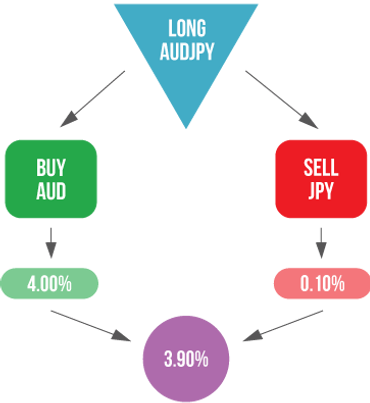
Let’s assume that you went long on AUDJPY and kept the position open overnight until the next day. Essentially you are buying AUD and selling JPY. What happens the next day is that your forex broker will either debit or credit you the overnight interest rate difference between the two currencies. This rolling over of your position is known as the carry trade.
Looking at the diagram above, if the interest rate earned on AUD is 4.00 percent and JPY is 0.10 percent, your profit from the interest rate differential is 3.9 percent per year! This is considered a positive carry trade. A negative carry trade happens when you buy JPY and sell AUD, meaning you would end up with a negative interest rate differential.
This example is based on 1:1 leverage and assumes exchange rates remain constant for the whole year.
Leverage
Now imagine applying leverage. In the example above, if you had a leverage of 100:1, your return would now be 100 x 3.9% = 390% on just the interest rate differential!
When Are Carry Trades More Successful?
If the central bank in Australia were to raise interest rates, then you would make even more gains. Therefore, you have to be mindful of the economic conditions in Australia. If the Reserve Bank of Australia is optimistic about the economy, then they will likely raise rates.
However, if the economy is sluggish and the RBA believes it needs to lower rates to stimulate the economy, then the AUDJPY as a carry trade would not be that successful. Meanwhile, if the AUDJPY exchange rate moved higher, in addition to higher interest rates, your long position on the pair would gain even more!